
BLOG

SA Innovators 2021 - Surviving the pandemic with the help of technology - Recap
Advance Business Consulting held its SA Innovators 2021 focusing on Innovation and Digital Transformation. This years event focussed on how three business leaders tackled the pandemic and how technology can be part of the solution in dealing with disruption.

Welcome to the recap of Innovators 2021, our second event focussing on innovation and digital transformation in South Australia.
This year was a little different! Disruption from the COVID-19 pandemic over the past two years has affected every business in some way and technology has been a part of the solution in helping businesses to operate and survive.
Challenges can lead to new opportunities and we heard of some bold decisions that had a big impact on business operations.
This year we also added a live stream to the event to allow people to watch the presentations from anywhere, including guests from interstate and you can watch the recording above or by clicking here.
Our speakers included local business leaders:
Andrew Bullock - Managing Director at 1834 Hotels
David Smith - Manager Corporate Services at Meals on Wheels SA
Peter Crescitelli - Manager – Technology & Information Security at MIGA
Emcee and panel discussion led by Troy Forrest - Managing Director at Strategy Road
A few of the key takeaways:
Andrew shared how he was able to reduce the complexity of his business, improve business intelligence reporting with automation and this has enabled 1834 Hotels to separate themselves from their competitors.
David explained that implementing an Intelligent Information Management System allowed his group to digitise their financial model, saving his business $50K per year while increasing efficiency and security.
Peter detailed how he has been able to move the legal arm and Operations arm of his group to a paperless system. This has allowed his business to have a foolproof auditing system which is extremely important for anyone in a heavily regulated environment.

Panel discussion introductions by John-Paul | Director at Advance Business Consulting
Here at Advance, we have been working with clients for over 20 years to help them integrate data, provide insights with leading BI tools and automate processes with content management.
if you would like to know how we can assist you, get in touch with us here or:
(08) 8238 6500
If you would like to learn more about the benefits of using an Intelligent Information Management System, you can watch a short video below about M-Files, a key technology we use internally and a foundation to managing content and digitising any business.

A little more about the speakers:
1834 Hotels
Andrew also leveraged the disruption to implement a new core business system during an interrupted period in the accommodation industry. 1834 Hotels also strengthened business intelligence to automate reporting, freeing up staff from manual spreadsheets and found new insights from daily agile reports and dashboards.
Meals on Wheels SA
David was also able to simplify and streamline financial processes to improve efficiency and compliance. Meals on Wheels automated a manual business process to enable a robust system for processing accounts payable invoices and volunteer reimbursements. This also delivered transparency and an audit trail. The new business process has reduced duplication and has made the role of Branch Treasurer much less onerous.
Medical Insurance Group Australia
Peter and the team at MIGA further digitised manual paper-based processes across their Claim Management and Accounts Payable business functions to deliver efficiency and compliance for MIGA. The operational efficiencies have delivered a great customer experience for internal & external stakeholders. MIGA’s strategy will continue to look into optimising these processes and expanding document management to other areas of the business.
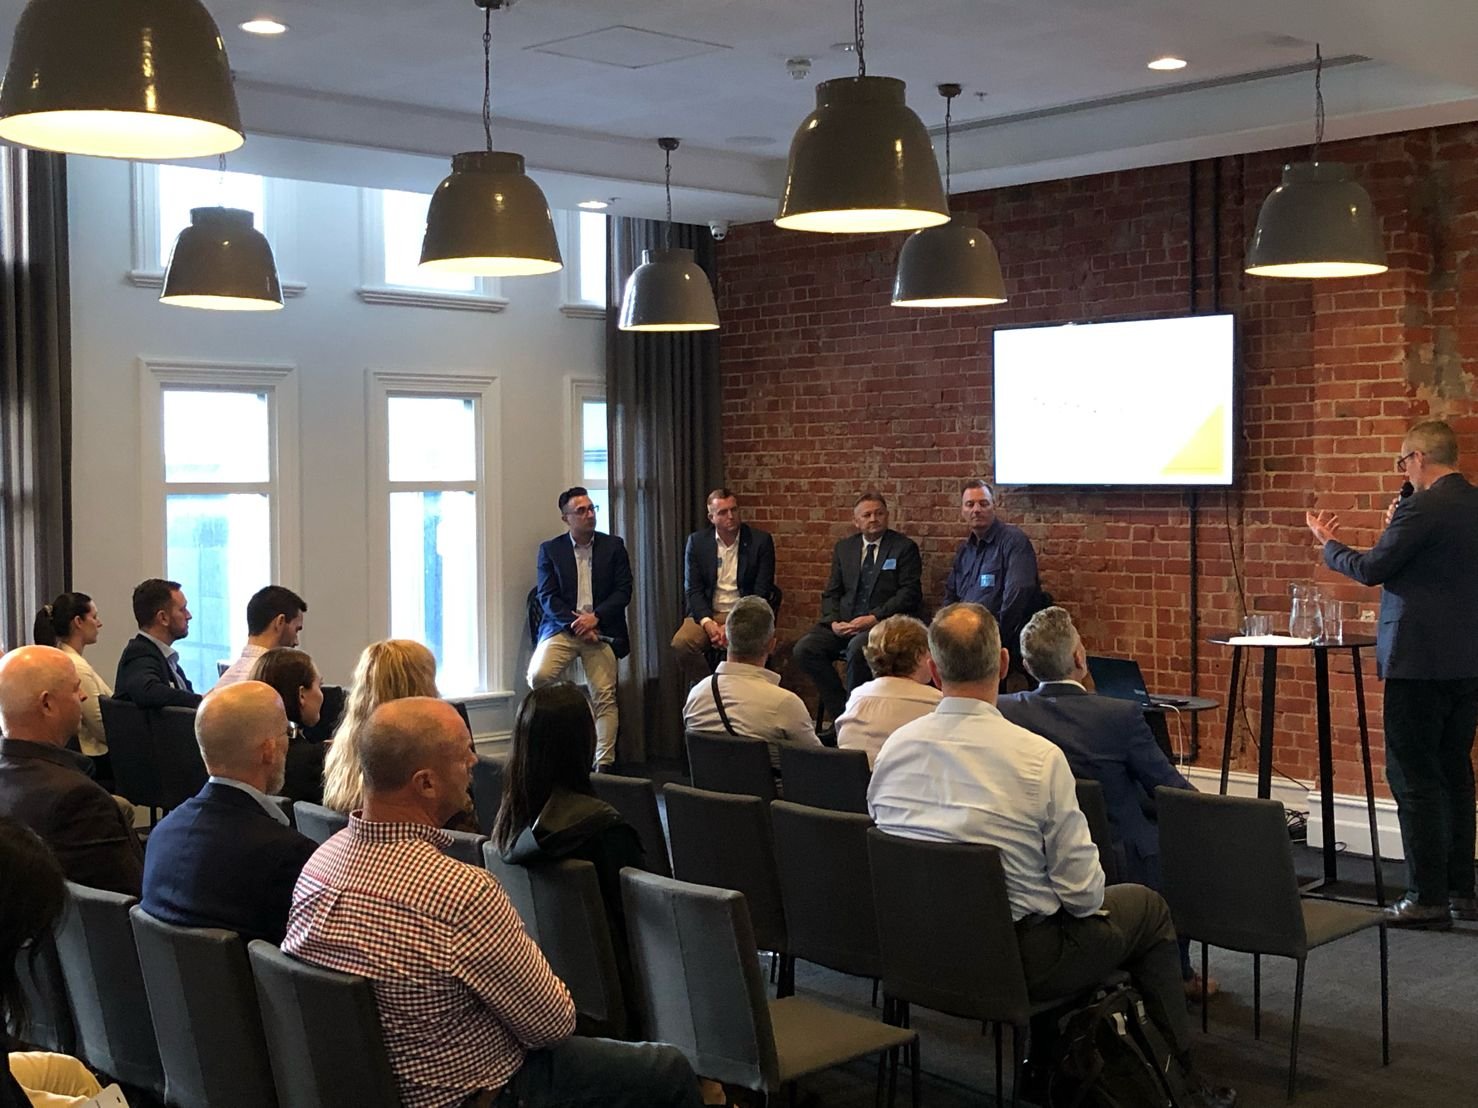
Troy Forrest leading the panel discussion.

A lot of good discussions prior and post event.
Our event was held at Electra house, live-streamed using www.streamadelaide.com.au
For any further information regarding SA Innovators 2021 or how Advance can help implement a successful digital process in your industry, get in touch with us here.


BI | Drowning in Excel reports. Employee retention. Some unexpected benefits from deploying a business intelligence platform like Power BI and Qlik.

Here is one recent example of how a business intelligence tool can deliver more than just new operational insights.
The client: Multiple systems, multiple sites, time and labour-intensive manual reporting
The result: Timely, automated reports, new insights with an instant feedback portal
Next Steps: Deployed to mobile with chat, user accountability and predictive analytics
Managing a business is very much about the people that you work with. The clients that rely on our services to run their business and the employees at Advance that are responsible for delivering these business systems. Clients and employees both need to have a good level of customer satisfaction or relationships can fall apart.
It was interesting to hear from my peers about situations where talented employees have left their jobs because of frustrations caused by data overload and using a process that is inefficient, manual, slow and often frustrating. There are times when work will be challenging and that is a part of life, but throwing more labour into a manual process to get the result is not a good long-term solution.
Companies that foster employee growth through technology innovation will improve staff retention. We try to adopt innovative tools early that are good value and this means our team is always learning new skills. The users of these solutions on the client side are eager to adopt a new system if it makes their work life easier and more productive.
Employee satisfaction and retention was an unexpected benefit from deploying a successful business intelligence platform.
Below is a BI solution we have been working on which is quite a common example where daily reporting is needed and there simply aren’t enough hours in a day to manually pull all of the data from the various branches and the 30+ systems. This type of reporting will cause frustration to any employee, especially if they are tasked with manually accessing each branch early every morning to build a complete view of the businesses performance.
The Challenge
Multiple sites, often in the double digits. 30 sites are not uncommon
Multiple disparate business systems across different locations, systems like Xero, MYOB, SAP, many others for HR functions and client facing systems
Be aware that although powerful, API’s are not built equally and something that performs well in a mature system like SAP may not provide the same data and consistency in something like MYOB. The ability to manipulate the data is a critical aspect of connecting multiple data sources
Time-consuming and labour-intensive manual reporting
The window for generating daily reporting not big enough to generate reports on time
Sites spread across multiple geographies and time zones
Manual, static Microsoft Excel reports to consolidate data into PowerPoint and then emailed each day

versus

Using Traditional Reporting Encountered Some Of These Challenges
Hardly scalable and very prone to human error
Time-consuming, manual and inefficient
Not a lot of fun. Repetitive tasks
Staff turnover is high
Inefficient with no automation
Slow
Missed opportunities
No forward projection or predictive analytics
Linking performance to industry systems that benchmark against competitors in the same industry was not possible
Reporting can look inconsistent and not well branded when required for management reporting
A Better Solution
A business intelligence solution connecting all of the systems and data into a single verified view of the truth
Automated, consistent, branded and uniformly formatted reports and dashboards
Dynamic insights that can be queried, drilled down for further detail
Automatic red flag warnings for KPI’s that are underperforming or outliers
Opportunities for further growth in positive KPI’s
Data pulled directly from each system, automatically calculated, verified and disturbed in minutes
Manageable distribution via internal systems like Slack or email to a selected user or group based on title or credentials
Connected to external data sources such as local weather to provide further insights and predictable analytics
Easily managed by employees without any special training
Portal for reporting commentary enabling stakeholder feedbacks
Secure and only the right people have access

The Results
Finance now quickly generate required reporting each day for 9:00AM reviews
Holistic reports for entire business across all 30 locations
New insights for things like revenue vs payroll
Automated reports are distributed each day to key stakeholders
Increased efficiency, productivity and employee satisfaction
Finance can focus on actions versus generating reports
Minimal manual reporting – there is always some needed and the human touch.
Consistent presentation with clear branding
Instant feedback on the numbers via comments on a secure portal
Final Thoughts
A well thought out BI implementation will connect all these business systems and inputs to build accurate business reports and dashboards. Smarter insights and visualisations with automated reporting will reduce risk and provide the feedback needed to manage a business effectively with a holistic view.
Enabling your team with valuable tools will teach them new skills and a reduction in manual inefficient processes will lead to better job satisfaction.
Tools like Qlik and Power BI are powerful, they will pull together all the systems so you can start building meaningful insights. Qlik is remarkably good at this. By linking to virtually any data source will let you manipulate data to build reports without the need for a data warehouse. The benefit is that it is more cost effective, quick to get answers, often within days not weeks. We have connected to a clients systems in a demonstration right there on the spot and built a report from a live system which is very compelling. Speed to new insights and value is a key benefit when using a tool like Qlik.
A Common Question
How do you get started? The first step to any project is getting access to the data.
If you would like to know more or have any questions about BI, get in touch with us here. We are passionate business intelligence experts.

CONTACT OUR SALES TEAM - NIK VILLIOS | ACCOUNT EXECUTIVE
PHONE: +618 8238 6521
MOBILE: +61 408 800 753
EMAIL: NVILLIOS@ADVANCE.NET.AU

Digital Transformation | Innovators 2019 Kick Off Event - Recap
Advance Business Consulting held its SA Innovators 2019 Kick Off Event last Thursday evening, focusing on Innovation and Digital Transformation within various industries. Key speakers on the night included Elyse Mitani, Graham Berry (Mitani Group), Michael Auciello (Chemist King & PharmPack) & Julien Berteraut (Intrexx).

Advance Business Consulting has been helping companies build their technology advantage for over 20+ years. With the growth in data, an opportunity exists to gain new insights and leverage operational efficiencies - A better, automated way of doing things. Organisations must be more vigilant than ever in remaining innovative and future-proofing their businesses. This is critical in remaining profitable and competitive.
Last Thursday, Advance held its SA Innovators / 2019 Kick Off Event, showcasing the road to success a handful of clients have achieved through Innovation and Digital Transformation.
The forum provided an opportunity for everyone to share their challenges and journey in digitising their business and processes, where to start and some unexpected findings along the way.
Inspirational and engaging discussions with key speakers from local and global industries; including Elyse Mitani, Graham Berry (Mitani Group), Michael Auciello (Chemist King & PharmPack) & Julien Berteraut (Intrexx).

Abby Brown (Intrexx) & Nik Villios (Advance)

Graham Berry & Elyse Mitani (Mitani)
KEY FINDINGS FROM THE EVENT:
John-Paul from Advance kicked off the event with an overview on digital trends for 2019 and an introduction to some of the projects and clients that Advance has worked with in recent years.
Mitani is the name behind many of Australia’s leading food manufacturing brands and a key part of their supply chain. They started a project in 2014 in an effort to improve document sharing in their R&D Department.
Over the last 4 years Mitani have continued to expand their digital workplace footprint and now utilise a central document management system, automated workflow and timely audit and compliance system. A business system used across the entire organisation to drive continuous improvement and insights into the business. A link to Mitani’s presentation has been included below.

Michael Auciello (Chemist King / PharmPack)
Michael Auciello delivered an interesting talk about the development of PharmPack Solutions, an online platform for medication ordering, prescription management and real-time communication between clients, care facilities, healthcare professionals and the pharmacist. PharmPack is another South Australian innovative business with a vision to make the medical ordering and fulfilment process as simple, easy and error-free as possible. Michael's journey provided his views and experience of where to begin when moving from a manual paper based process and some of the challenges common to all projects.
Finally Julien Berteraut from Intrexx spoke about the digital landscape we live in today, some interesting data points and examples of how clients in Europe and in Australia are using platforms like Intrexx to create web-based applications for automated workflows, electronic forms and the powerful impact of portals.
Intrexx is a cross-platform integrated development environment for the creation and operation of web-based applications, enterprise portals and intranet portals. Julien is experienced in digital transformation and has worked with many different clients based in Europe and globally. A link to the Intrexx presentation has been included below.

Julien Berteraut (Intrexx)


Over 100 new and existing faces filled the Electra House venue on the night, highlighting the popularity and appetite for digital innovative transformations. Advance would like to once again thank all the speakers and guests who made the event a huge success.
For any further information regarding the SA Innovators 2019 Kick Off Event, or how Advance can help implement a successful digital process in your industry, get in touch with us here.